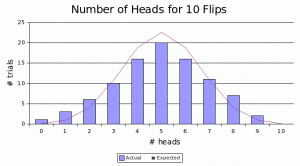
It started as a math project for my fourth-grade daughter and turned into a lesson in project management. I flipped a coin 10 times, counted 3 times that it came up heads, and recorded this on a bar chart: the bar labeled “3” on the axis labeled “Number of Heads,” one trial. We repeated the experiment, recording more trials to the chart. Eventually, we colored a familiar bell curve, big in the middle and tapering off to the sides. Each trial, we expected to see 5 heads, and on average, that’s what we got. Sometimes, we got more or fewer, and once we even got none, but mostly we got about 5.
Everyone intuitively understands the bell-shaped probability curve. We expect 5 heads each 10 flips. Yes, we could get more or fewer, but it’ll likely be about 5, with decreasing probability as we get further from the expected value.
Now let’s turn the problem around. Let’s do the converse experiment. What if we needed 5 heads? How many times would we have to flip the coin in order to get 5 heads? We expect about 10 flips, though we could get all 5 heads in a row. Or we might have to flip the coin as many as– Well, there a 95% chance we’ll get 5 heads within 15 flips of the coin, but if everything goes wrong, we theoretically could have to flip it a million times before we see 5 heads.
We expect to have to flip the coin 10 times. This is the point of 50% probability. It’s equally likely to take at least 10 flips as to take less than 10. If it takes fewer, we’ll still need to flip the coin at least 5 times. But if more, it could take substantially more. There’s a significant chance it could take 15 or even more flips to get those 5 heads. And the probability curve doesn’t have a simple bell shape. Rather, it stretches off to the right into infinity. We expect to flip the coin 10 times, but we may need to flip many, many more times.
It’s a shame this system has become standard estimating procedure in software development. Most managers ask, “When will it be done?” We try to answer. No one should be surprised if it takes significantly longer than we expected. But somehow we always are.
Let’s say we’ve completed 5 stories, totaling 9 units of work, as follows:
| Story | Units of Work (U) | Days to Complete (d) |
|---|---|---|
| A | 2 | 5 |
| B | 1 | 3 |
| C | 1 | 2 |
| D | 3 | 12 |
| E | 2 | 7 |
That gives us an average velocity of 0.31 U/d, with a standard deviation of 0.07 U/d. But we weren’t asked for our velocity, how fast we can work, how much work we can get done. Rather we were asked how long before we’re done.
So let’s suppose our remaining stories total 20 U. When can we have them done? Nominally, in 65 days. But there’s a 15% chance our velocity could be up to one standard deviation slower than average, which would take 83 days. And there’s a 2% chance our velocity could be up to two standard deviations slower than average, which would take a whopping 117 days. To summarize:
| There’s a probability of | that we’ll be done within |
|---|---|
| 50% | 65 days |
| 85% | 83 days |
| 98% | 117 days |
Try explaining this to management if you want to see what they look like when they panic. “A hundred seventeen days?!” Yup, but chances are we’ll be done within 83. “Eighty-three days?!”
We can try taking smaller bites. Let’s say we estimate the next iteration, including only the next 9 units of work. This makes the numbers smaller, but they’re still scary.
| There’s a probability of | that we’ll be done within |
|---|---|
| 50% | 29 days |
| 85% | 38 days |
| 98% | 53 days |
What’s more, how do our iterations stack? How will more data affect our long-term plans? Our estimates will get more accurate, so the 85% and 98% dates will come in closer to the 50% date. Likewise, the 50% date may move forward or back to track reality more accurately. But it’s hard to put together a mental picture of how this works.
Instead, let’s try time-boxed iterations. Let’s say our next iteration is 20 days. (October 2005 has 20 weekdays in it.) In 20 days, we can nominally complete stories totaling 6 U, plus or minus 2. How simple is that? Or if things get really bad–only a 2% chance of this–we may need to sacrifice another unit of work. So maybe we commit to 3 or 4 units of work, holding additional stories in reserve, to work on if we have time.
Additionally, as we accumulate more data regarding our work, our estimates should become more accurate. Our average velocity will move closer to our true expected velocity. The standard deviation should also get smaller; therefore, we should be able to commit in each iteration to more of the work we’ll actually be able to finish, holding fewer stories in reserve.
Note that the time-boxed picture is no rosier; the implications are the same. But time-boxed iterations seem to be more intuitive, easier to understand. Therefore, it should be easier to make decisions regarding time-boxed iterations, thus to manage them.
A note on computing average velocity and standard deviation: For a set of stories s∈S, with units of work us and time to completion ts, we can estimate the average velocity ![[mu]](http://sd.jtimothyking.com/wp-content/uploads/2005/09/average.gif) and the standard deviation
and the standard deviation ![[sigma]](http://sd.jtimothyking.com/wp-content/uploads/2005/09/standard_deviation.gif) .
.


By Anonymous September 26, 2005 - 1:24 pm
Waltzing with Bears…
Nice summarization of this! It’s discussed in more detail in DeMarco & Lister’s Waltzing with Bears: Managing Risk on Software Projects, which I highly recommend.
By Tim King September 26, 2005 - 3:23 pm
Re: Waltzing with Bears…
This book’s on my “Gotta Read This Someday” list. I’ll have to bump it up in priority.
-TimK
By fenrircatenatus September 29, 2005 - 2:05 pm
Most likely random, but this just reminded me of the opening scenes from Rosencrantz and Guildenstern Are Dead, where they’re discussing the laws of probability when the coin keeps coming up heads.
I don’t think I believe in probability. It would state that good things would happen 50% of the time, and bad things would happen 50% of the time. But as bad things seem to happen to me about 90% of the time – and have for as long as I can remember, I don’t think I buy into probability 😉
And none of this – Well you only remember the bad things – crap!
😉
By cratermoon October 9, 2005 - 12:31 am
Good analysis. I think I’ll have to sit down and see the numbers that come up if we work backwards from a given time. That is, given a certain velocity, how many stories are we likely to complete in the next two-week iteration, and what’s the standard deviation for fewer or more complete.
By Hugo Humphrey July 18, 2025 - 7:07 pm
I very delighted to find this internet site on bing, just what I was searching for as well saved to fav
By Kenny Livingston July 20, 2025 - 12:52 am
very informative articles or reviews at this time.
By Erica Perkins July 21, 2025 - 7:05 am
For the reason that the admin of this site is working, no uncertainty very quickly it will be renowned, due to its quality contents.
By Jax Garrett July 27, 2025 - 2:37 pm
naturally like your web site however you need to take a look at the spelling on several of your posts. A number of them are rife with spelling problems and I find it very bothersome to tell the truth on the other hand I will surely come again again.
By Londyn Eaton July 28, 2025 - 5:55 am
For the reason that the admin of this site is working, no uncertainty very quickly it will be renowned, due to its quality contents.
By 创建Binance账户 December 4, 2025 - 3:14 am
Can you be more specific about the content of your article? After reading it, I still have some doubts. Hope you can help me. https://www.binance.info/register?ref=IHJUI7TF
By binance us registrācija December 18, 2025 - 11:04 am
I don’t think the title of your article matches the content lol. Just kidding, mainly because I had some doubts after reading the article. https://accounts.binance.info/es-AR/register?ref=UT2YTZSU
By Рестраця на Binance January 3, 2026 - 3:09 pm
Thanks for sharing. I read many of your blog posts, cool, your blog is very good.
By Създаване на профил в binance January 6, 2026 - 6:09 pm
Your point of view caught my eye and was very interesting. Thanks. I have a question for you.
By Тркелу January 16, 2026 - 12:37 am
Your article helped me a lot, is there any more related content? Thanks!
By binance kod January 20, 2026 - 12:32 am
Your article helped me a lot, is there any more related content? Thanks! https://www.binance.info/register?ref=IXBIAFVY
By sign up binance January 24, 2026 - 9:22 am
I don’t think the title of your article matches the content lol. Just kidding, mainly because I had some doubts after reading the article. https://accounts.binance.com/es-MX/register?ref=GJY4VW8W